Making Better Use of Lighthouse with Puppeteer
There are tools we can use to evaluate the performance, accessibility, and the use of web developer best practices on our websites and in our web apps. One of these tools is built into Google Chrome. It’s called Lighthouse.
Lighthouse analyzes web apps and web pages, collecting modern performance metrics and insights on developer best practices.
The metrics you get back tell you how well a particular webpage is setup and configured to give the best possible user experience on multiple vectors, like page performance, accessibility, and SEO. It even gives you actions to implement that will improve your score and thus your webpage’s or web app’s user experience.
It’s easy to run because it’s built directly into Google Chrome and can even emulate different device types. If you are using Chrome and reading this article now, take some time and run Lighthouse:
- Right click on this webpage and select
Inspect. - Go to the
Auditstab and clickGenerate Reports.
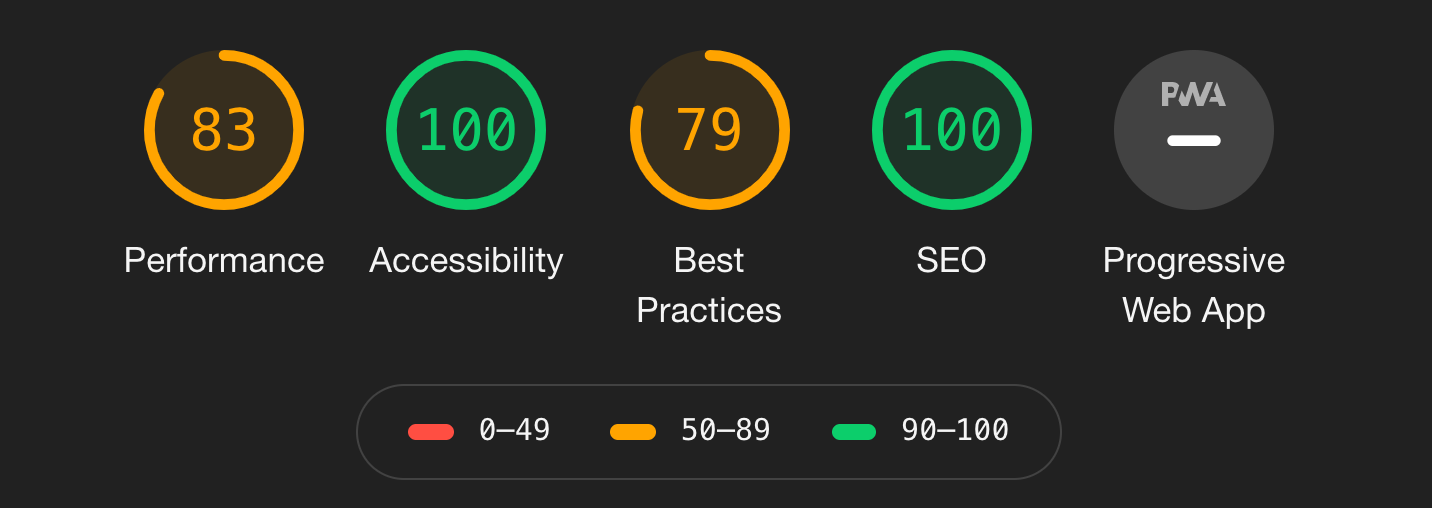
I ran it on my About page and my results are as follows:

Full disclosure, this is the latest score. I ran this the first time a few days ago and had a disappointing, 79, as my accessbility score. It recommended that I add alt text attribute to my profile photo and aria-labels to the icons in the top right. I did and now I have a perfect score and more importantly, this webpage is more accessible.
You can also run it at the command line, by installing and running the Node module
npm install -g lighthouse
lighthouse https://evanhalley.dev/about
The output is a HTML report that resembles the report generated in Chrome Dev Tools.
Being a Node module, it’s pretty easy to run Lighthouse programmatically.
const lighthouse = require('lighthouse');
const chromeLauncher = require('chrome-launcher');

function launchChromeAndRunLighthouse(url, opts, config = null) {
  return chromeLauncher.launch({chromeFlags: opts.chromeFlags}).then(chrome => {
    opts.port = chrome.port;
    return lighthouse(url, opts, config).then(results => {
      // use results.lhr for the JS-consumable output
      // https://github.com/GoogleChrome/lighthouse/blob/master/types/lhr.d.ts
      // use results.report for the HTML/JSON/CSV output as a string
      // use results.artifacts for the trace/screenshots/other specific case you need (rarer)
      return chrome.kill().then(() => results.lhr)
    });
  });
}

const opts = {
  chromeFlags: ['--show-paint-rects']
};

// Usage:
launchChromeAndRunLighthouse('https://example.com', opts).then(results => {
  // Use results!
});
What if we needed to run Lighthouse on a webpage that is behind some type authentication, like many web apps are? This is where Puppeteer comes in handy.
Scenario
For this scenario, I am imaging I am a web developer at HungerRush. HungerRush (aka Revention) provides an online ordering platform like DoorDash or Postmates. I picked them because a pizza place local to me, Salvio’s, uses their platform to enable online ordering. I want to write a script that will run Lighthouse on the account management page, which is behind an authentication wall.
The webpage I will be testing is https://salviospizza.hungerrush.com/Order/OrderType.
The goal here is to use Puppeteer to log into the website. When this happens, the website will use cookies to remember the fact that I logged in. I will then pass the Google Chrome browser instance used by Puppeteer and the URL to the account page to Lighthouse. Lighthouse will open a new tab in this Chrome instance and do it’s thing. The output is a report data object containing all of the information generated by Lighthouse.
Let’s get started:
Logging In
This part is not particularly important. Your implementation will definitely differ depending on how users are able to log into your website. Using Puppeteer, I can log into the account page with the following code:
const fs = require('fs');
const puppeteer = require('puppeteer');
const lighthouse = require('lighthouse');
const config = require('lighthouse/lighthouse-core/config/lr-desktop-config.js');
const reportGenerator = require('lighthouse/lighthouse-core/report/report-generator');

const PIZZA_PROFILE_URL = 'https://salviospizza.hungerrush.com/Account/Manage';
const browser = await puppeteer.launch({ headless: true });

console.log('Navigating to Pizza Profile...');
const page = (await browser.pages())[0];
await page.goto(PIZZA_PROFILE_URL, { waitUntil: 'networkidle0' });

console.log('Starting login, entering username and password...');
await page.type('#UserName', process.env.USERNAME);
await page.type('#Password', process.env.PASSWORD);

console.log('Logging in....');
await Promise.all([
    page.waitForNavigation({ waitUntil: 'networkidle0' }),
    page.click('#btnLogin'),
]);

console.log('Pizza profile unlocked!');
Running the snippet logs me in to my profile!
The Handoff to Lighthouse
The handoff to Lighthouse is straightforward. Lighthouse communicates with Google Chrome in the same way Puppeteer does, over CDP (Chrome DevTools Protocol). I simply get the port of the running Chrome instance and give that to Lighthouse, along with the URL to evaluate, and some other parameters.
const config = require('lighthouse/lighthouse-core/config/lr-desktop-config.js');

console.log('Running lighthouse...');
const report = await lighthouse(PIZZA_PROFILE_URL, {
    port: (new URL(browser.wsEndpoint())).port,
    output: 'json',
    logLevel: 'info',
    disableDeviceEmulation: true,
    chromeFlags: ['--disable-mobile-emulation', '--disable-storage-reset']
}, config);
The method, browser.wsEndpoint(), returns a value that resembles ws://127.0.0.1:63980/devtools/browser/666ea71c-a4e4-4777-962c-e26b6cf41ccd.
Once we have the raw report object we can generate HTML and/or JSON versions of the information and save it to disk.
const json = reportGenerator.generateReport(report.lhr, 'json');
const html = reportGenerator.generateReport(report.lhr, 'html');
console.log(`Lighthouse scores: ${report.lhr.score}`);

console.log('Writing results...');
fs.writeFileSync('report.json', json);
fs.writeFileSync('report.html', html);
console.log('Done!');
You probably wouldn’t need both types of reports, depending on your use case. In continuous integration environment that has implemented this type of per-build Lighthouse analysis, I can see the JSON version being more usable (and machine-parsable) than the HTML version.
This entire code sample has been uploaded to GitHub.
🧇